5 Simple Steps for Multifamily Funnel Benchmarking Everyone Should Employ

Summary – The 5 Main Steps for Multifamily Benchmarking
Step 1. Decide which KPIs matter most
Step 2. Measure your baselines and set your benchmarks
Read the conclusion and how to get started.
Many of us are inherently curious – often wondering what others are doing. And this tendency spans across both our personal and professional lives. While on the personal side, measuring ourselves against others might not be recommended, on the professional side, the use of benchmarking as a means to compare our performance to others’ performance provides valuable context and insight.
Multifamily marketing is no exception – owners and operators seek to understand property and portfolio performance within a contextual framework as a means to assess performance. They need a way to better understand whether performance in a certain area is something to be celebrated, a critical issue to be attended to, or simply an unchangeable reality (the result of conditions – often market related – that are out of their hands).
And yet, in conversations with industry innovators and thought leaders, many confess that while they recognize the importance of benchmarking, it isn’t something they have institutionalized at their companies.
Whether you’re a benchmarking rookie or a pro, these five simple steps will help you get up and running in no time.
Step 1. Decide which KPIs matter most
The list of KPIs (key performance indicators) you can benchmark is endless, but your attention span and time aren’t. So, it’s important to focus on setting and tracking against benchmarks that are most relevant to your role, team, portfolio, and bottom line. For instance, at a corporate level you might want to set a benchmark for Leads to New Leases conversion across properties and teams and monitor overall changes to funnel efficiency. Marketing might be keen to benchmark and track New Website Visitors to Leads conversion so the team can ensure property websites are meeting required standards of excellence. Regionals might benchmark and track Tours to Lease Applications conversion as a means to target and monitor desired closing ratios on-site, and spot any trending leasing performance issues.
Sample Benchmarks by Team Type
Marketing
(Top of Funnel and Lower Funnel focus)
New Website Visitors > Leads Conversion %
Cost per Lead
Leads > Tours Conversion %
Cancellation & Denial %
Cost per New Lease
Average Revenue by Channel
Average Return on Investment by Channel
Property Management
(Middle and Lower Funnel focus)
Tours
Tours > Lease Applications Conversion %
Asset Management
(Revenue and Expense focus)
Marketing Costs
Occupied %
Exposed %
Payback on Property Marketing Investment
Sample Benchmarks by asset stage
Properties in Lease-Up
(Leasing focus)
Lease Applications
New Leases
Stabilized Properties
(Retention focus)
Renewals
Notices to Vacate
Retention %
Mixed Stage Portfolios
(Efficiency focus)
Leads > New Leases Conversion %
Cancellation & Denial %
Learn More With a 15 Minute Remarkably Introduction:
Step 2. Measure your baselines and set your benchmarks
Baseline measures are your KPI starting points, that which you can set benchmarks and measure change against. Baselines are important to the benchmarking process because they give you information about historical averages, highs, and lows, across a period of time. That information can be used to set best practice benchmarks. Sometimes people are reluctant to look at past performance data during difficult and challenging times—as has been the case during the coronavirus pandemic—but a close look at actual results and averages across both high and low periods over time can help set realistic expectations, maintain focus, and bolster morale among the team moving forward.
Once you’ve identified the most important KPIs to you and your team and you’ve measured historical KPI performance, you can set benchmarks to measure performance against over time. These should be achievable, but represent desired standards of excellence for you and your organization.
Step 3. Monitor and measure
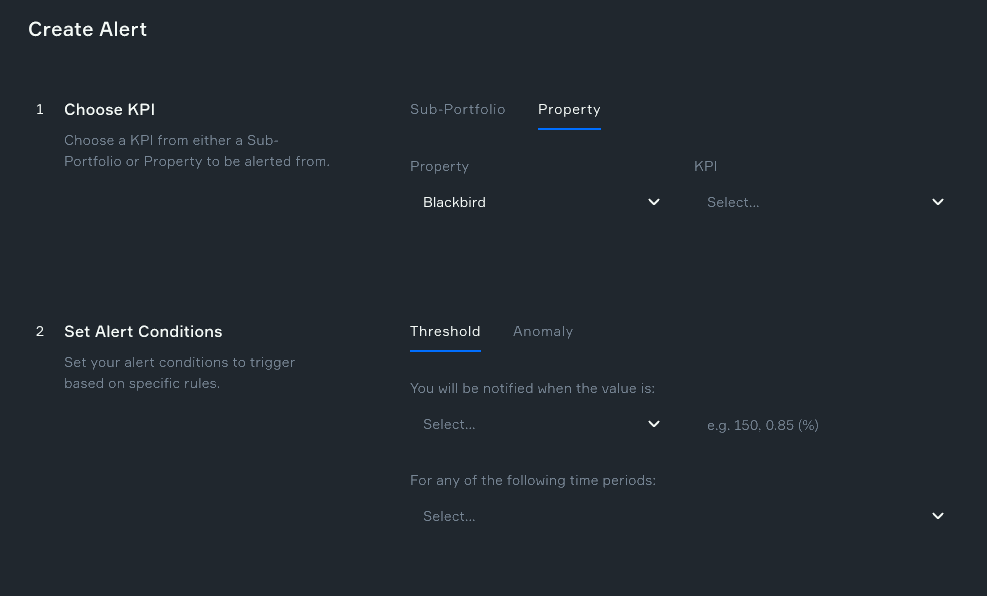
At Remarkably, we are firm believers that you get what you measure. Steps one and two above only deliver value if you then monitor and measure performance and adjust accordingly. Setting machine-learning powered alerts for all your selected KPIs mean that you can be alerted immediately when a property is having any break point in its funnel and proactively address the issues before they begin impacting occupancy and corresponding NOI.
Step 4. Analyze
With steps 1-3 in place, you can more easily see which properties, marketing channels, and leasing teams are meeting or not meeting best practice benchmarks, and more in depth-analysis can be focused in the highest impact areas. For instance, does one property consistently have lower than average Lead > New Lease conversion rates? Does one marketing channel consistently produce better Cost per Lead results? Does a certain on-site team consistently have lower number of Notices to Vacate than your portfolio average? Being alerted to consistent exceptions to best practice benchmarks can help identify issues and focus attention to fixing them before they become future Occupancy and NOI problems.
Step 5. Update as required
Even with steps 1-4 complete, there’s always going to be room for ongoing discovery and improvement. Benchmarks that were quickly and easily exceeded may point to exceptional performance by your team, competitive differentiation, or an opportunity to beat the market. Best practice targets that were never met may point to training and growth opportunities or NOI being left on the table. Create a regular practice of reviewing and refining your corporate benchmarks as required, likely on an annual basis.
Get started today
Analyzing full funnel baseline and benchmark data can be a time-consuming process, pulling from multiple data sets and platforms such as Google Analytics and Yardi Voyager. Remarkably’s integrated dashboard aggregates all this data at the click of a button, enabling you to set benchmarks and related alerts with ease.
To learn more about how to automate your benchmarking and begin improving asset and portfolio performance, reducing cost, and increasing team efficiency today, click here to request a demo.