Features Designed for the Industry’s Biggest Challenges

Sound familiar?

Remarkably’s answer

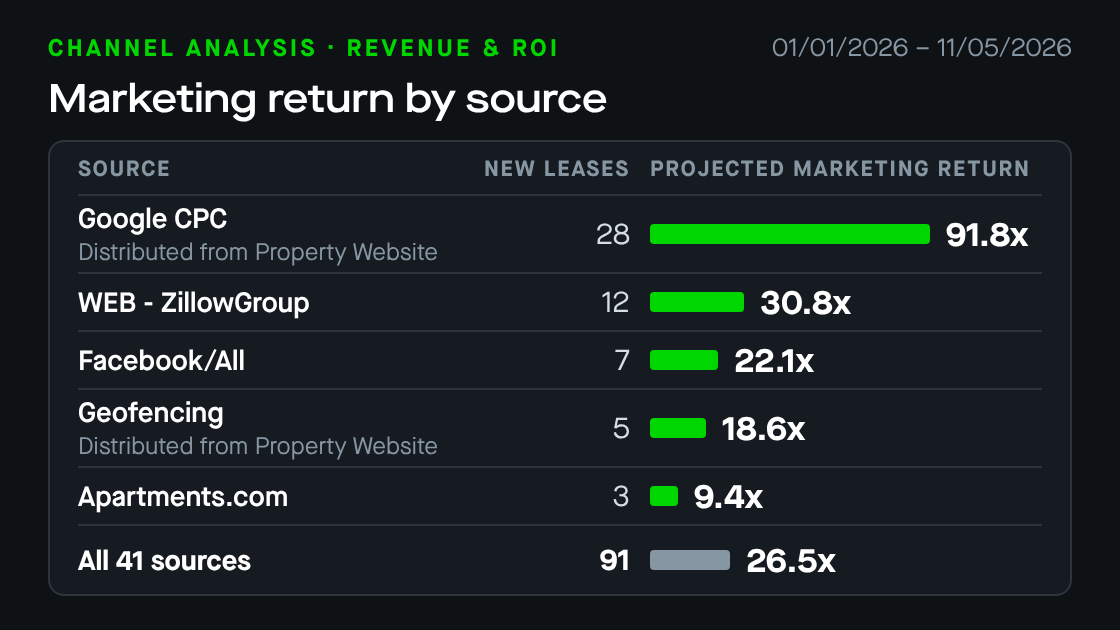
Channel Analysis

Finally, a better way to measure and report on channel and source performance to analyze your true marketing ROI.

Feature Highlights

Some of our customers’ favorites.

Integrated Dashboards

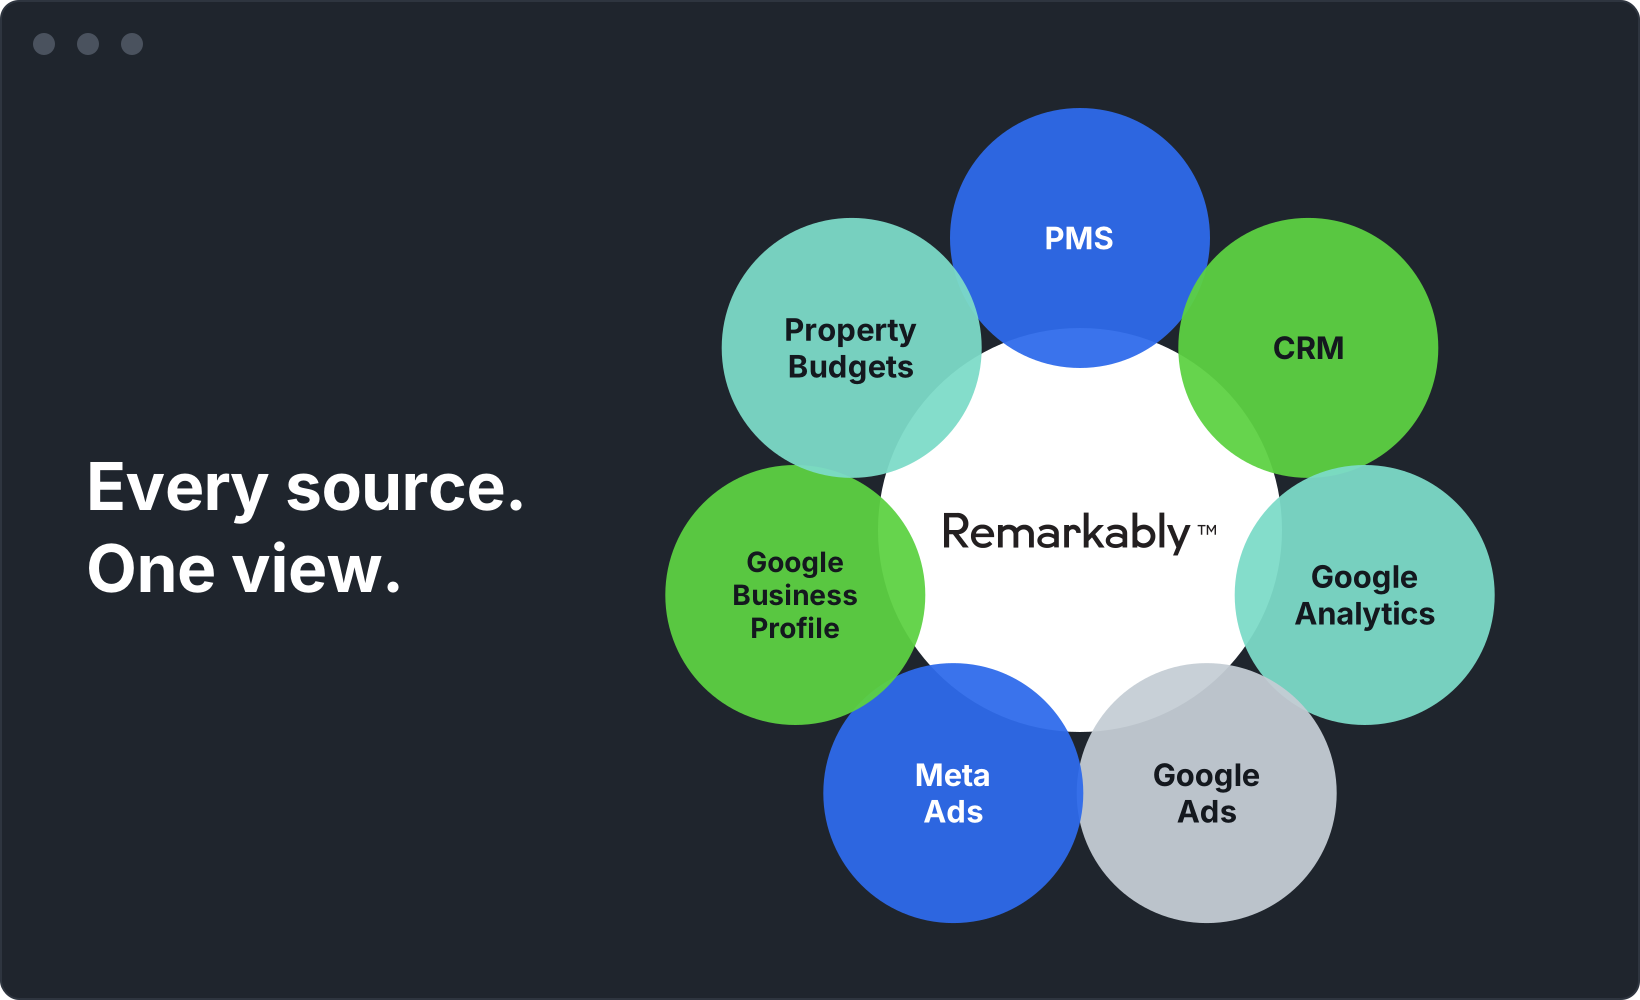
Today, data lives across Property Management Software, CRM, Google Analytics, Google Ads, Meta Ads, Google Business Profile, and property budgets, and simply aggregating it for a single property, let alone a portfolio, is time-consuming and error-prone. Remarkably’s custom APIs pull your most critical sources into one dashboard, available 24/7. Filter and custom-tag to see the whole portfolio, an owner’s portfolio, a region, or a single property, and use time series visualizations to spot trends, outliers, and patterns as they happen, not at the end of the month.
Channel Analysis

Tired of being told your “Property Website” is producing all your leads and leases? Remarkably connects your investment and source data, so you can analyze marketing expenses, volumes, conversion rates, cost pers, rent, new lease revenue, and return by source. See which sources generate the highest quality leads at the lowest cost, report marketing’s true ROI to stakeholders, and track source performance over time.

Property & Portfolio Intelligence Reports

NEW

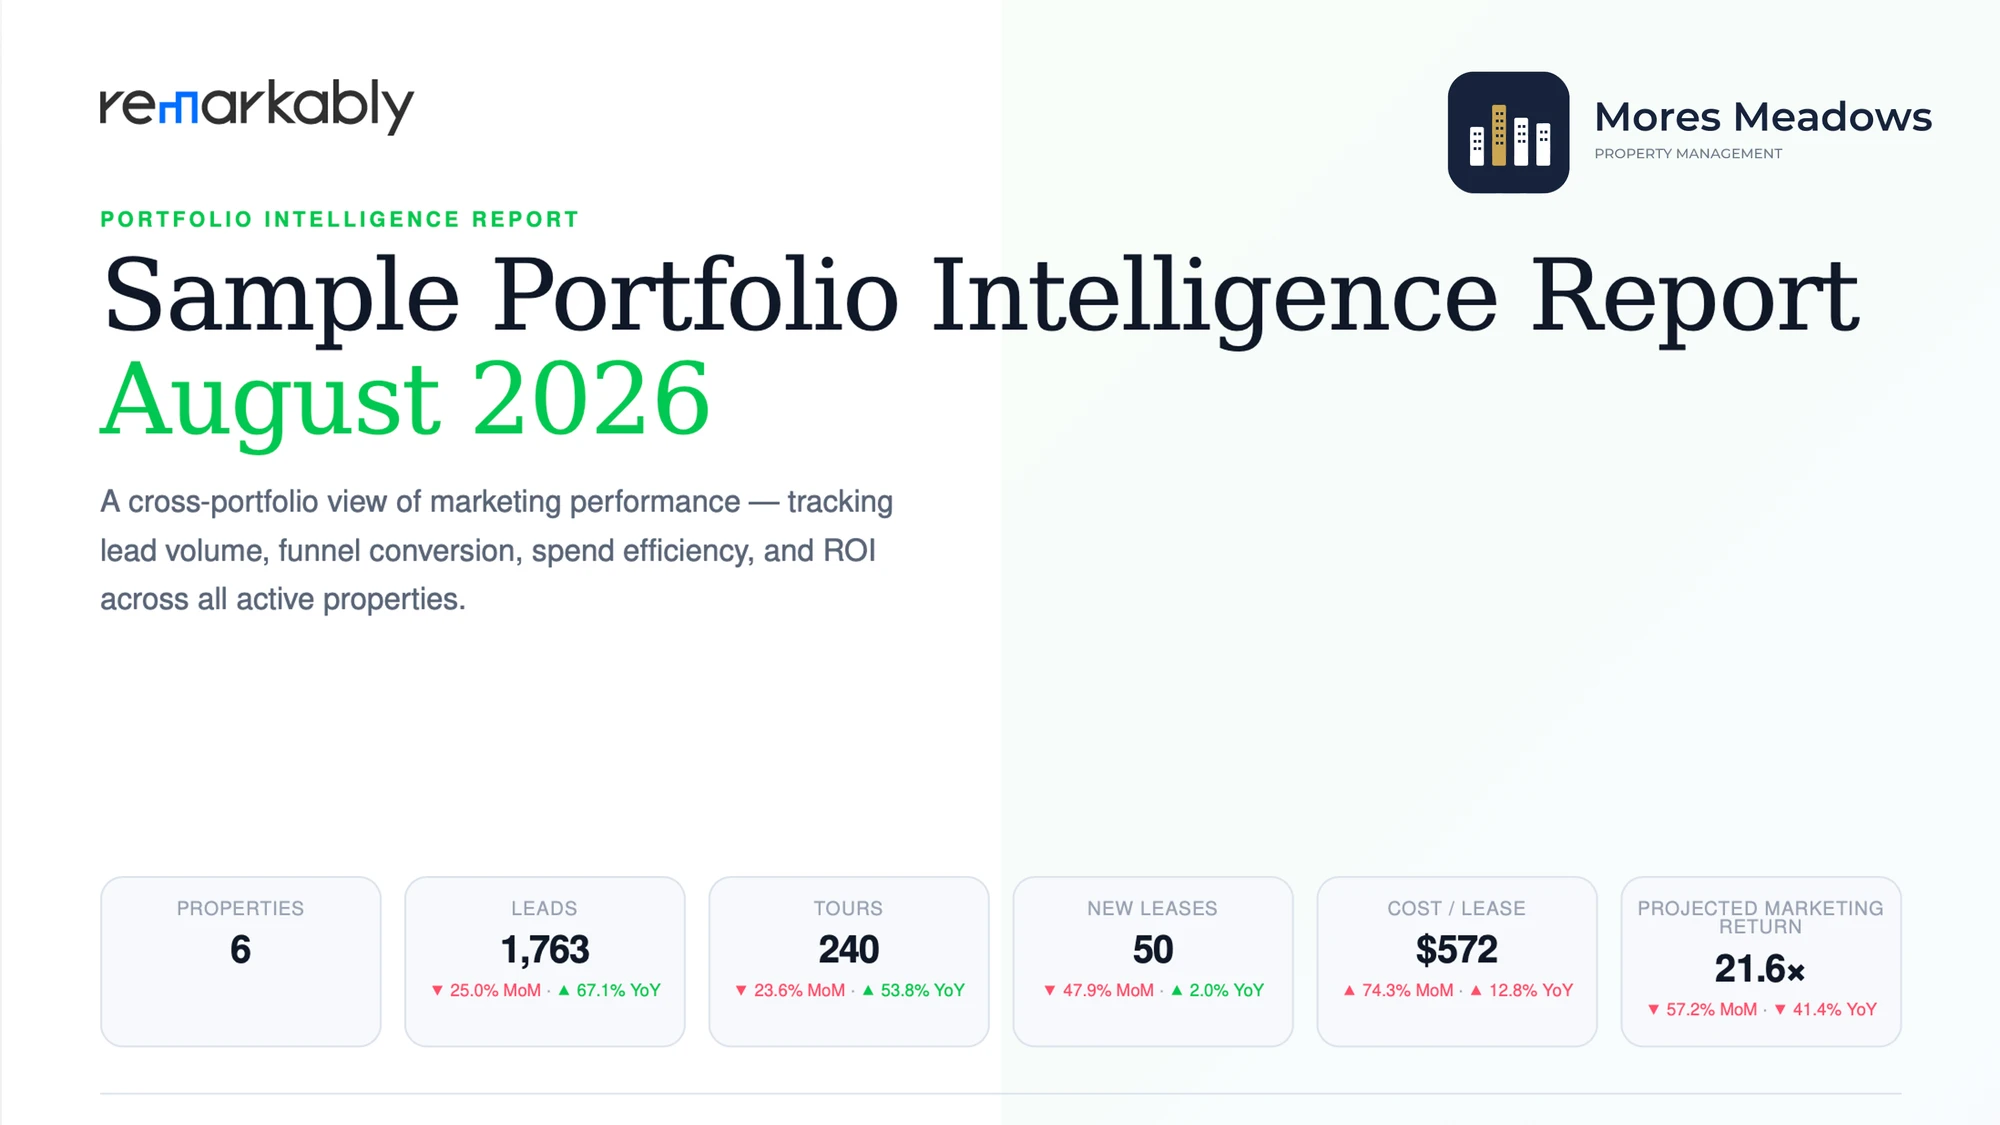
Property and Portfolio Intelligence Reports show your full marketing funnel in one place and the story behind every number, powered by AI: a KPI scorecard with month-over-month and year-over-year context, stage-by-stage conversion, a source-by-source breakdown of volume, spend, and cost per, marketing ROI, and plain-language insights. Co-brand them with your logo and schedule automated delivery. Need something custom? Build your own report once, then have it emailed on your cadence, exported to Excel, or pushed to a Google Sheet.

AI Analyst

Owners and executives are asking tougher, more frequent questions about property and portfolio performance. Remarkably’s AI Analyst analyzes marketing, leasing, and source performance for any time period, identifies positive and negative trend insights, and converts them into a written narrative. With a single click you can answer questions about funnel volumes, conversions, and cost pers by source, instead of manually wrangling all your data across various systems just to try and answer a stakeholder question that changes as soon as it’s asked.

Google Ads and Meta Ads Integration

NEW

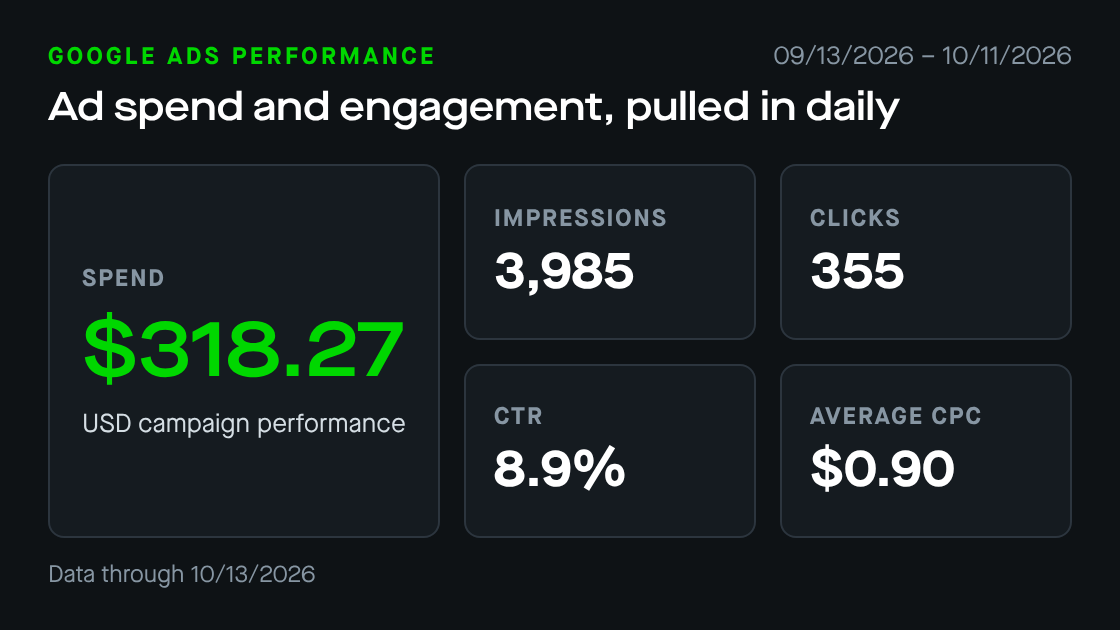
Remarkably is integrated with both Google Ads and Meta Ads, so your ad spend is ingested automatically every day. Analyze and report on ad source performance, cost pers, and ROI, and dig into ad-specific data such as impressions, interactions, clicks, link clicks, cost per click, and click-through rates. Finally, Marketers and their agencies, as well as Operations and Asset Management teams can see how advertising directly translates to leasing performance.

Benchmarking

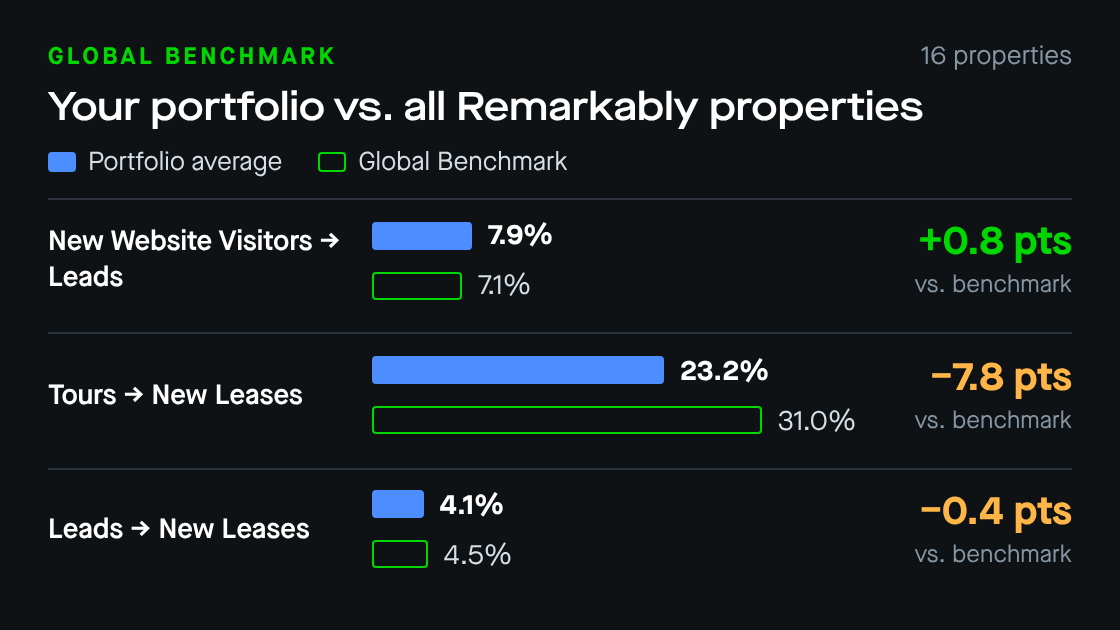
Benchmark your portfolio’s conversion rates at every funnel stage against three references. Custom Benchmark adds your own company targets for each funnel stage for easy reference. Global Benchmark compares your portfolio and properties to all Remarkably properties at each funnel stage, for any selected timeframe. Portfolio Average compares individual property performance against your overall portfolio averages.

Google Business Profile Integrations

NEW

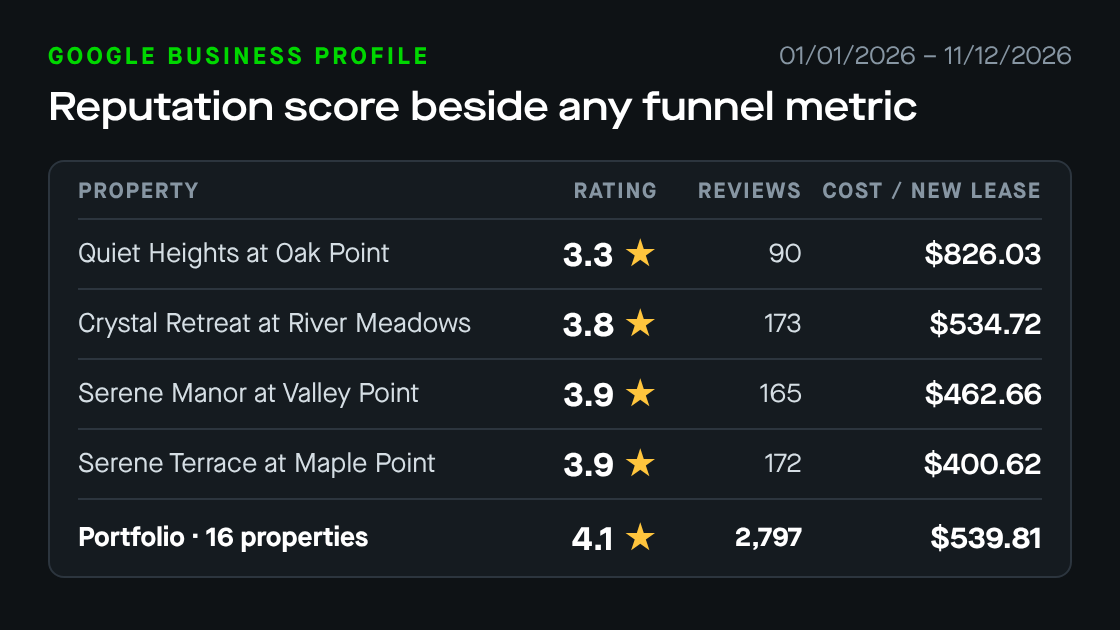
A property sitting at 2.9 stars on its Google Business Profile and one sitting at 4.7 stars are not competing on the same terms. Your reputation data now sits in the same view as your acquisition metrics, so you can line it up against Cost per Lead, Cost per Lease, Conversion Rates, and ROI, and answer questions like: are our lowest-rated properties also our most expensive to lease?

Chart Annotations

With portfolios growing and teams stretched thin, it’s nearly impossible to remember every change. Chart Annotations add a visualized, date-stamped note to your charts when key activities take place, such as “Launched Paid Advertising” or “Reduced Rents $500”. Paired with your KPI charts, they show how marketing and on-site changes affected lead, tour, and lease volume, for clearer team meetings and executive reporting.

Cohort Analysis

Reporting from PMSs and CRMs is transactional: you might see 10 leases last month but only 5 tours, and wonder where those leases came from. Cohort Analysis is relational. Select any group of prospects, track how long they take to move through each step of your funnel, and find the breakpoints. Compare cohorts too, such as whether leads produced in Q1 are converting faster than leads produced in Q2.

Configured Alerts

Marketing is often brought in only after a property is already suffering. Configured Alerts monitor your property and portfolio performance 24/7 and tell you about funnel stage issues, such as New Website Visitors to Leads conversions, before they hit asset performance. Each team member picks the KPIs that matter most to them. For Marketing, perhaps that's New Website Visitors to Leads, while Operations might be focused most on the onsite experience of Tours to Lease Applications. Asset Management can now manage by exception with regard to upcoming exposure, 30, 60, or 90 days out.

Exposure Analysis

Instantly identify the units you need to be focusing on most. Set alerts based on your custom criteria. For example, you could now trigger an alert anytime a 90-day exposure threshold exceeds 9.0% at a property.

See Remarkably in action.

Connect your multifamily data, receive actionable insights and alerts, and address property performance issues before they become problems.

Request Demo