The ‘Show Distributed Source Attribution’ toggle is a powerful control in the Channel Analysis report view. It allows you to switch between a view of your property website Lead Source performance, and your distributed Source(s) performance.
For more information about distributing Lead Sources, check out this article.
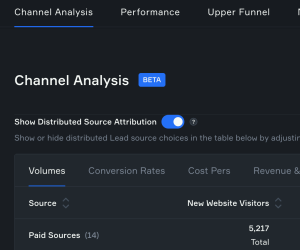
When you toggle ‘Show Distributed Source Attribution’ to the ‘on’ position, your property website Lead Source and related metrics will disappear and it will be replaced with the Source(s) you distributed your property website Lead Source to.
This ‘Distributed Source Attribution’ view gives you more meaningful and useful visibility into the underlying investments and sources driving traffic to your property website.
How are the results calculated?
The New Website Visitor (NWV) volumes associated with the website referral sources you distributed your Property Website Lead Source to are key to the distributed Source metrics. Those NWV volumes proportionately ‘weight’ the distributed Source volumes, conversion rates, cost pers, and revenue and ROI metrics, providing estimated and useful distributed source attribution.
Let’s review an example.
Imagine your property website Lead Source showed that you’d generated the following Volumes during the date range pre-set of ‘Last Year’, with the ‘Show Distribute Source Attribution’ toggle ‘off’.
| Source | New Website Visitors | Leads | Tours | Lease Applications | Approved Leases | New Leases |
| Property Website | 4,713 | 7 | 6 | 3 | 2 | 2 |
And let’s imagine that you or another Remarkably Admin had distributed that property website Lead Source to 5 organic search-related website referral sources in the Manage: Referral Sources view. (Reminder: for more information about distributing Lead Sources, check out this article.)
When you toggle ‘Show Distributed Source Attribution’ to ‘on’, you would see weighted distribution Volumes now looking something like this:
| Source | New Website Visitors | Leads | Tours | Lease Applications | Approved Leases | New Leases |
| Direct Traffic |
1,448
|
2.21
|
1.89
|
— | — | — |
|
Organic Google
|
3,144
|
4.79
|
4.11 |
3
|
2 | 2 |
| Organic Bing |
91
|
— | — | — | — | — |
| Organic Yahoo | 14 | — | — | — | — | — |
| Organic DuckDuckGo |
16
|
— | — | — | — | — |
As you can see from the example outlined in the table above, the New Website Visitors Volumes dictate how the Leads through New Leases results are distributed — proportionately.
Put simply, the higher the number of New Website Visitors a distributed Source has, the higher the Leads through New Leases estimated to be attributed to that Source will be. The lower the number of New Website Visitors a distributed Source has, the lower the Leads through New Leases estimated to be attributed to that Source will be.
The weighted Volumes then generate appropriate estimated conversion rates, cost pers, and revenue and ROI results.
A few important things to point out:
- ‘Property Website’ Lead Source’s Budgeted Expenses and Actual Expenses remain split evenly across the distributed sources, as was the case in the Beta version of this feature. By splitting it evenly, the ‘cost per’ metrics for each distributed source are then variable and indicate cost efficiency.
- ‘Null’ values indicated by em dashes in the Channel Analysis grid (shown as ‘–‘ above) indicate that the estimated value is less than 1.0, and so is not displayed or used as an input into calculations in the report. This helps avoid skewed and confusing metrics using very small decimal values (e.g. 0.003).
- Some rounding and recalculation may be applied to distributed Source metrics to achieve similar or exact results to non-distributed totals and averages.