My portfolio is growing by the month. It’s impossible to remember what happened at each property.
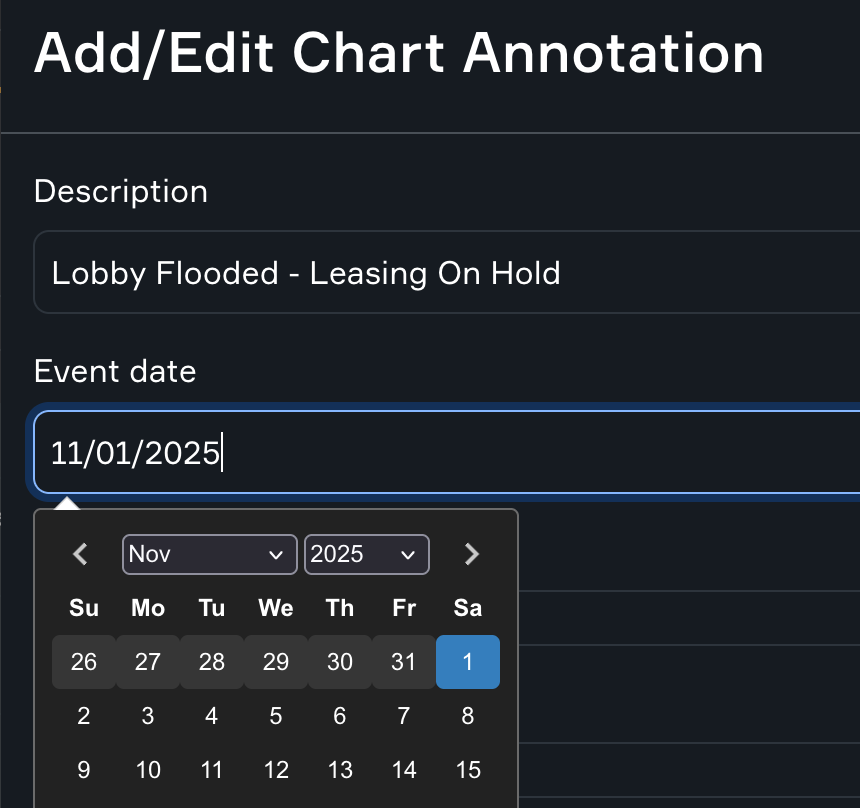
Our Chart Annotations let you assign a visualized, date stamped note on charts where you can note when key activities took place, such as “Launched Paid Advertising” or “Reduced Rents $500”.
Keep track of key changes at the property or portfolio level
With portfolios growing and teams stretched thinner than ever, it’s nearly impossible to remember every change. Our chart annotations keep track so you don’t have to.
A picture is worth 1,000 words
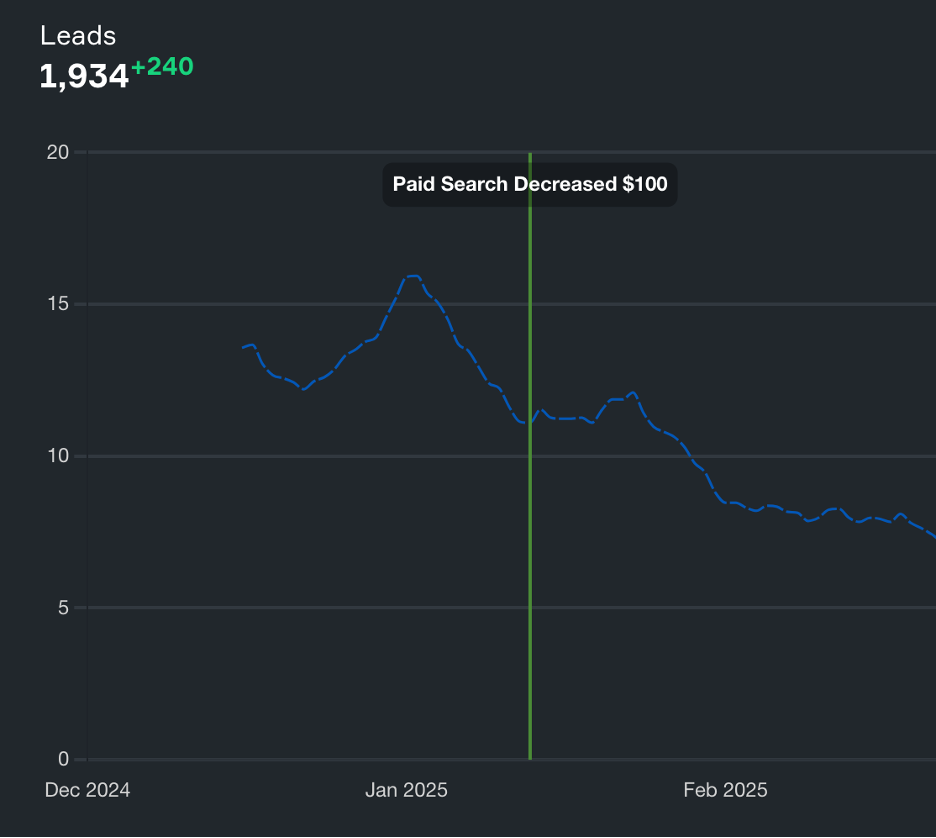
Data visualization is a powerful tool for team meetings, executive reporting, and more. Clearly see changes you made to your marketing campaign or onsite changes that happened and how that impacted performance.
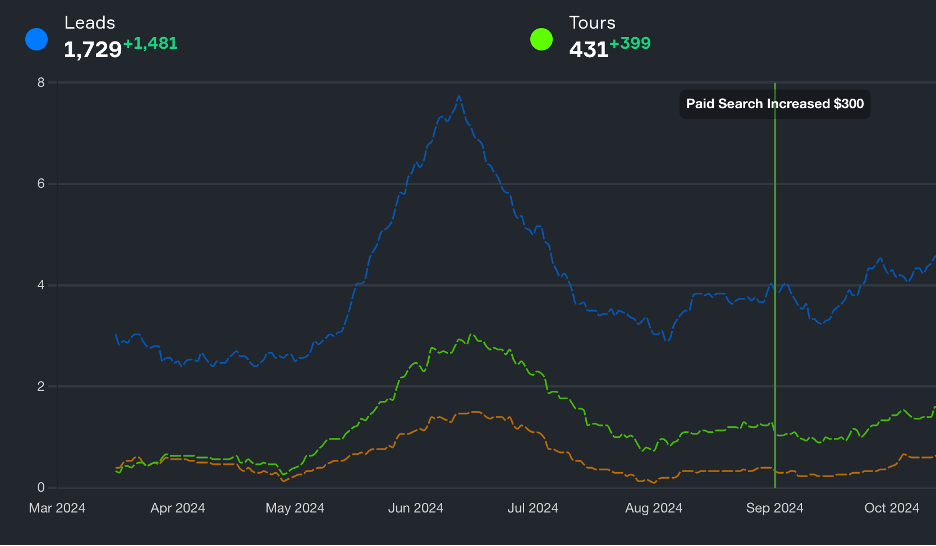
See how marketing changes impact performance
Clearly illustrate increases or decreases to your marketing spend and how that impacts lead, tour, and lease volume via chart annotations coupled with multiple KPI visualizations.
Learn More With a 15 Minute Introduction to Remarkably
Assign a visualized, date stamped note on charts.
Note when key activities took place, such as “Launched Paid Advertising” or “Reduced Rents $500”.
Keep track of all changes at all properties to inform reporting and stakeholder conversations.
We use cookies to ensure that we give you the best experience on our website. If you continue to use this site we will assume that you are happy with it.