fbpx

Platform

Drive funnel performance with marketing intelligence for multifamily operators

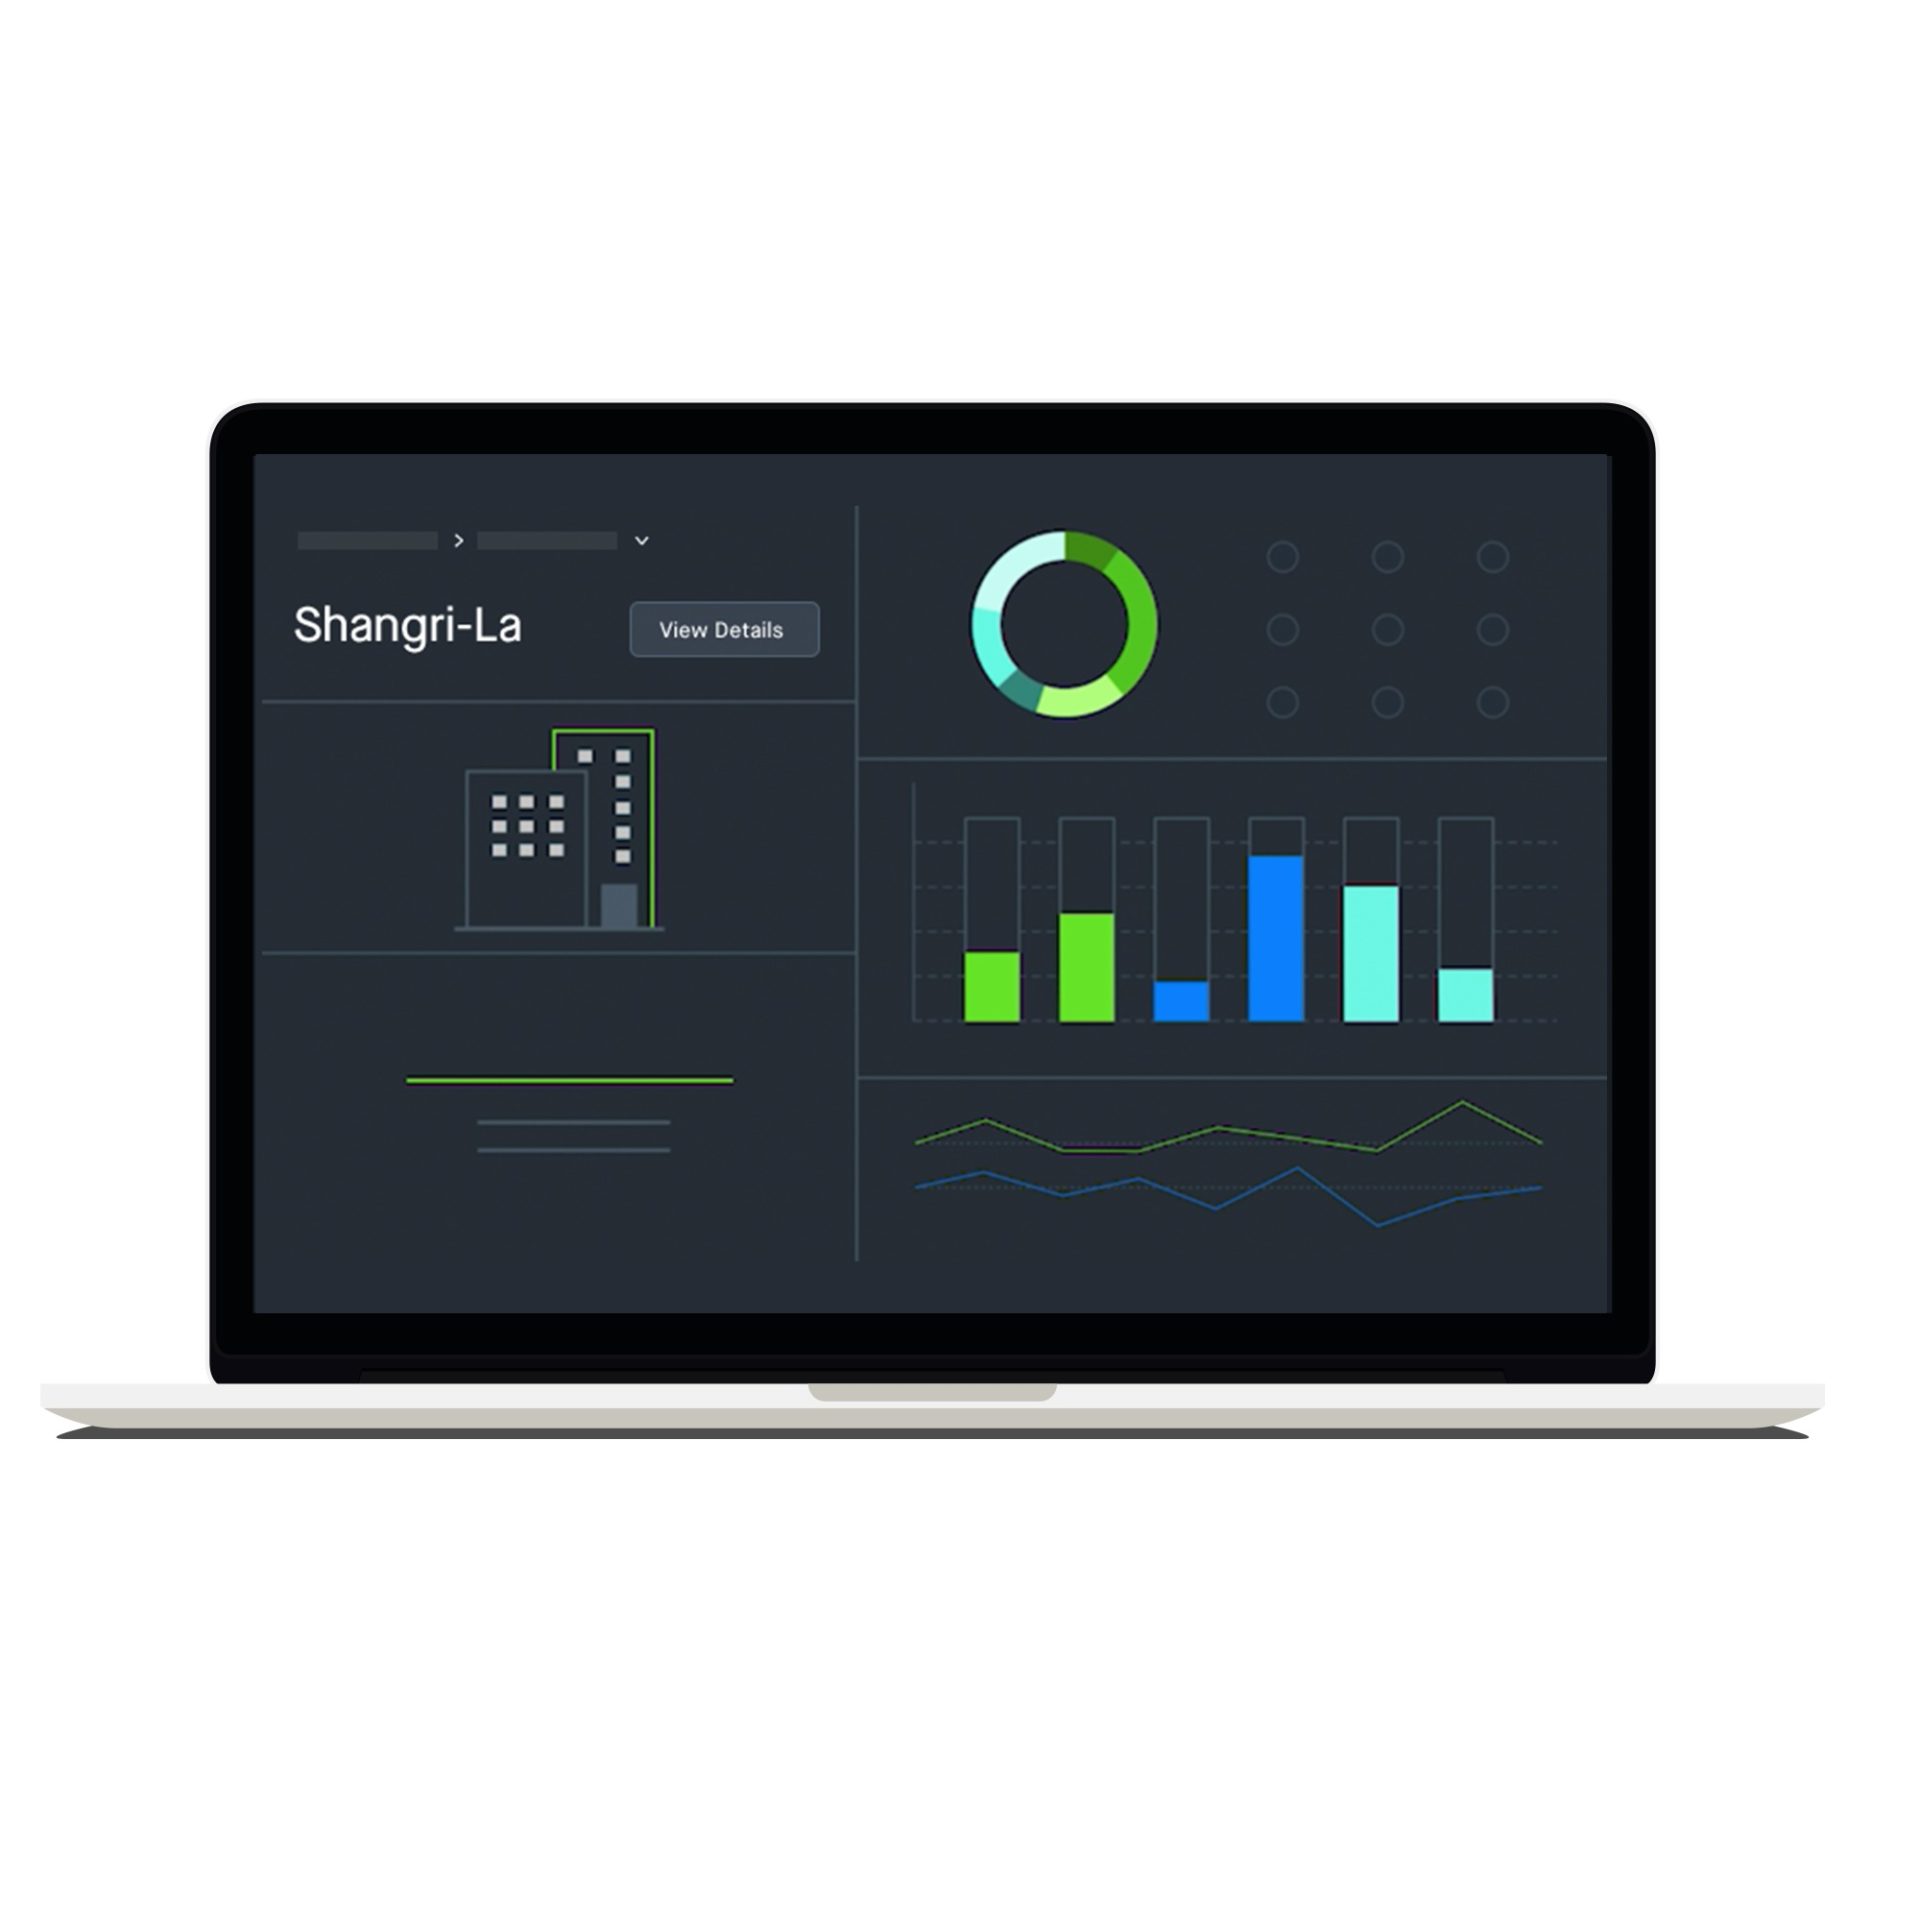
Laptop Screen showcasing Remarkably App

Connect & Normalize

Create an accurate, unified
view of funnel performance
across your portfolio.

Remarkably takes the marketing and leasing data that’s trapped within Yardi, RENTCafé, and Google Analytic, and aggregates it into a unified view that turns data into insights that power better decisions.

Connect data from anywhere in the organization.

Merge and access your data with Remarkably as the hub between all your systems.

Connect data from your PMS, CRM, GL, Google Analytics, and more, with flexible ingestion methods.

Enable your entire team to work from a common data set instead of emailing around hard-to-govern spreadsheets.

No more logging into dozens of separate reporting tools for an overview or an update.

Connect & Normalize Dashboard

Glean insights more quickly with blended data.

Eliminate confusion and ensure all your marketing, leasing, and financial information speak a common language.

Access a single networked view of your historical and current portfolio data for queries and analysis.

Eliminate data redundancies that adversely affect analysis and cause mistakes.

Gain control of your data, and easily build deeper in-house data and analytics capabilities.

Visualize & Analyze

Discover more ways to
optimize your portfolio.

Once your data is aggregated, Remarkably's multifamily portfolio intelligence software transforms it from raw to visualized with clicks (not code), and helps you put it to work in actionable, profitable ways.

Visualize & Analyze Graphs

See the whole picture.

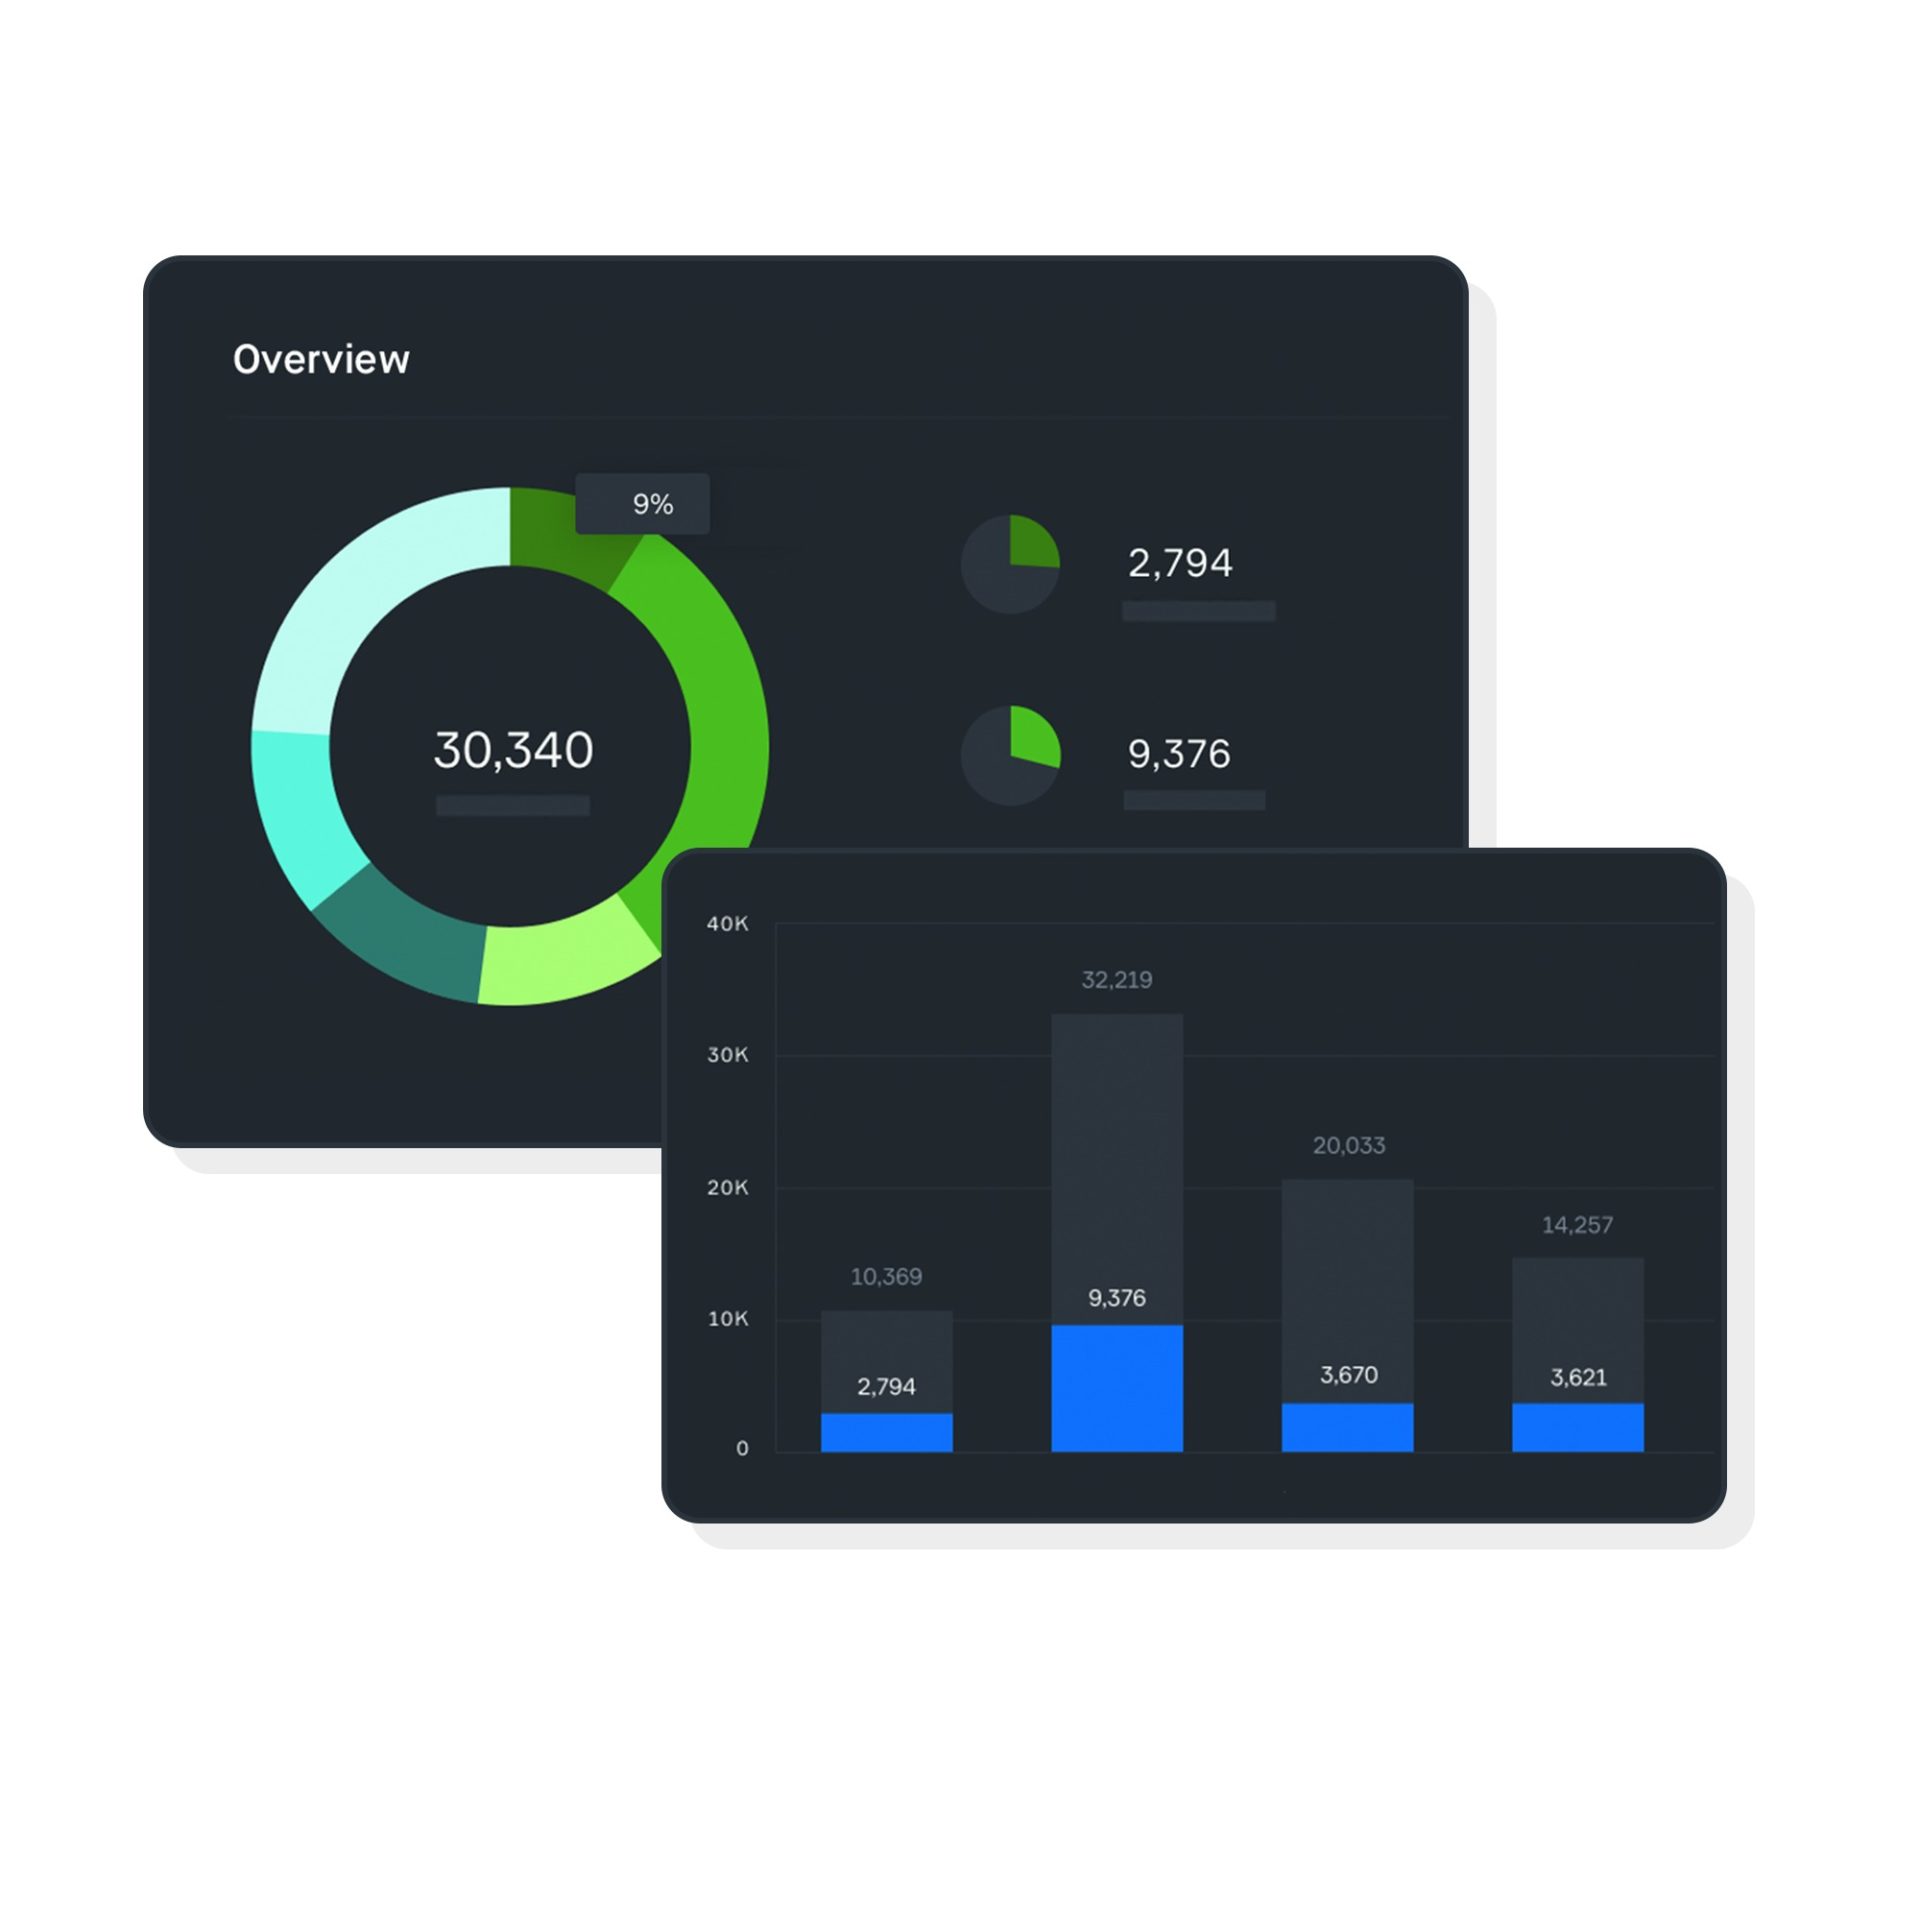
Gain end-to-end visibility with interactive dashboards, data visualizations, and charts that are easy-to-consume and share.

Turn massive amounts of data into digestible insights that align the company around a single set of meaningful KPIs.

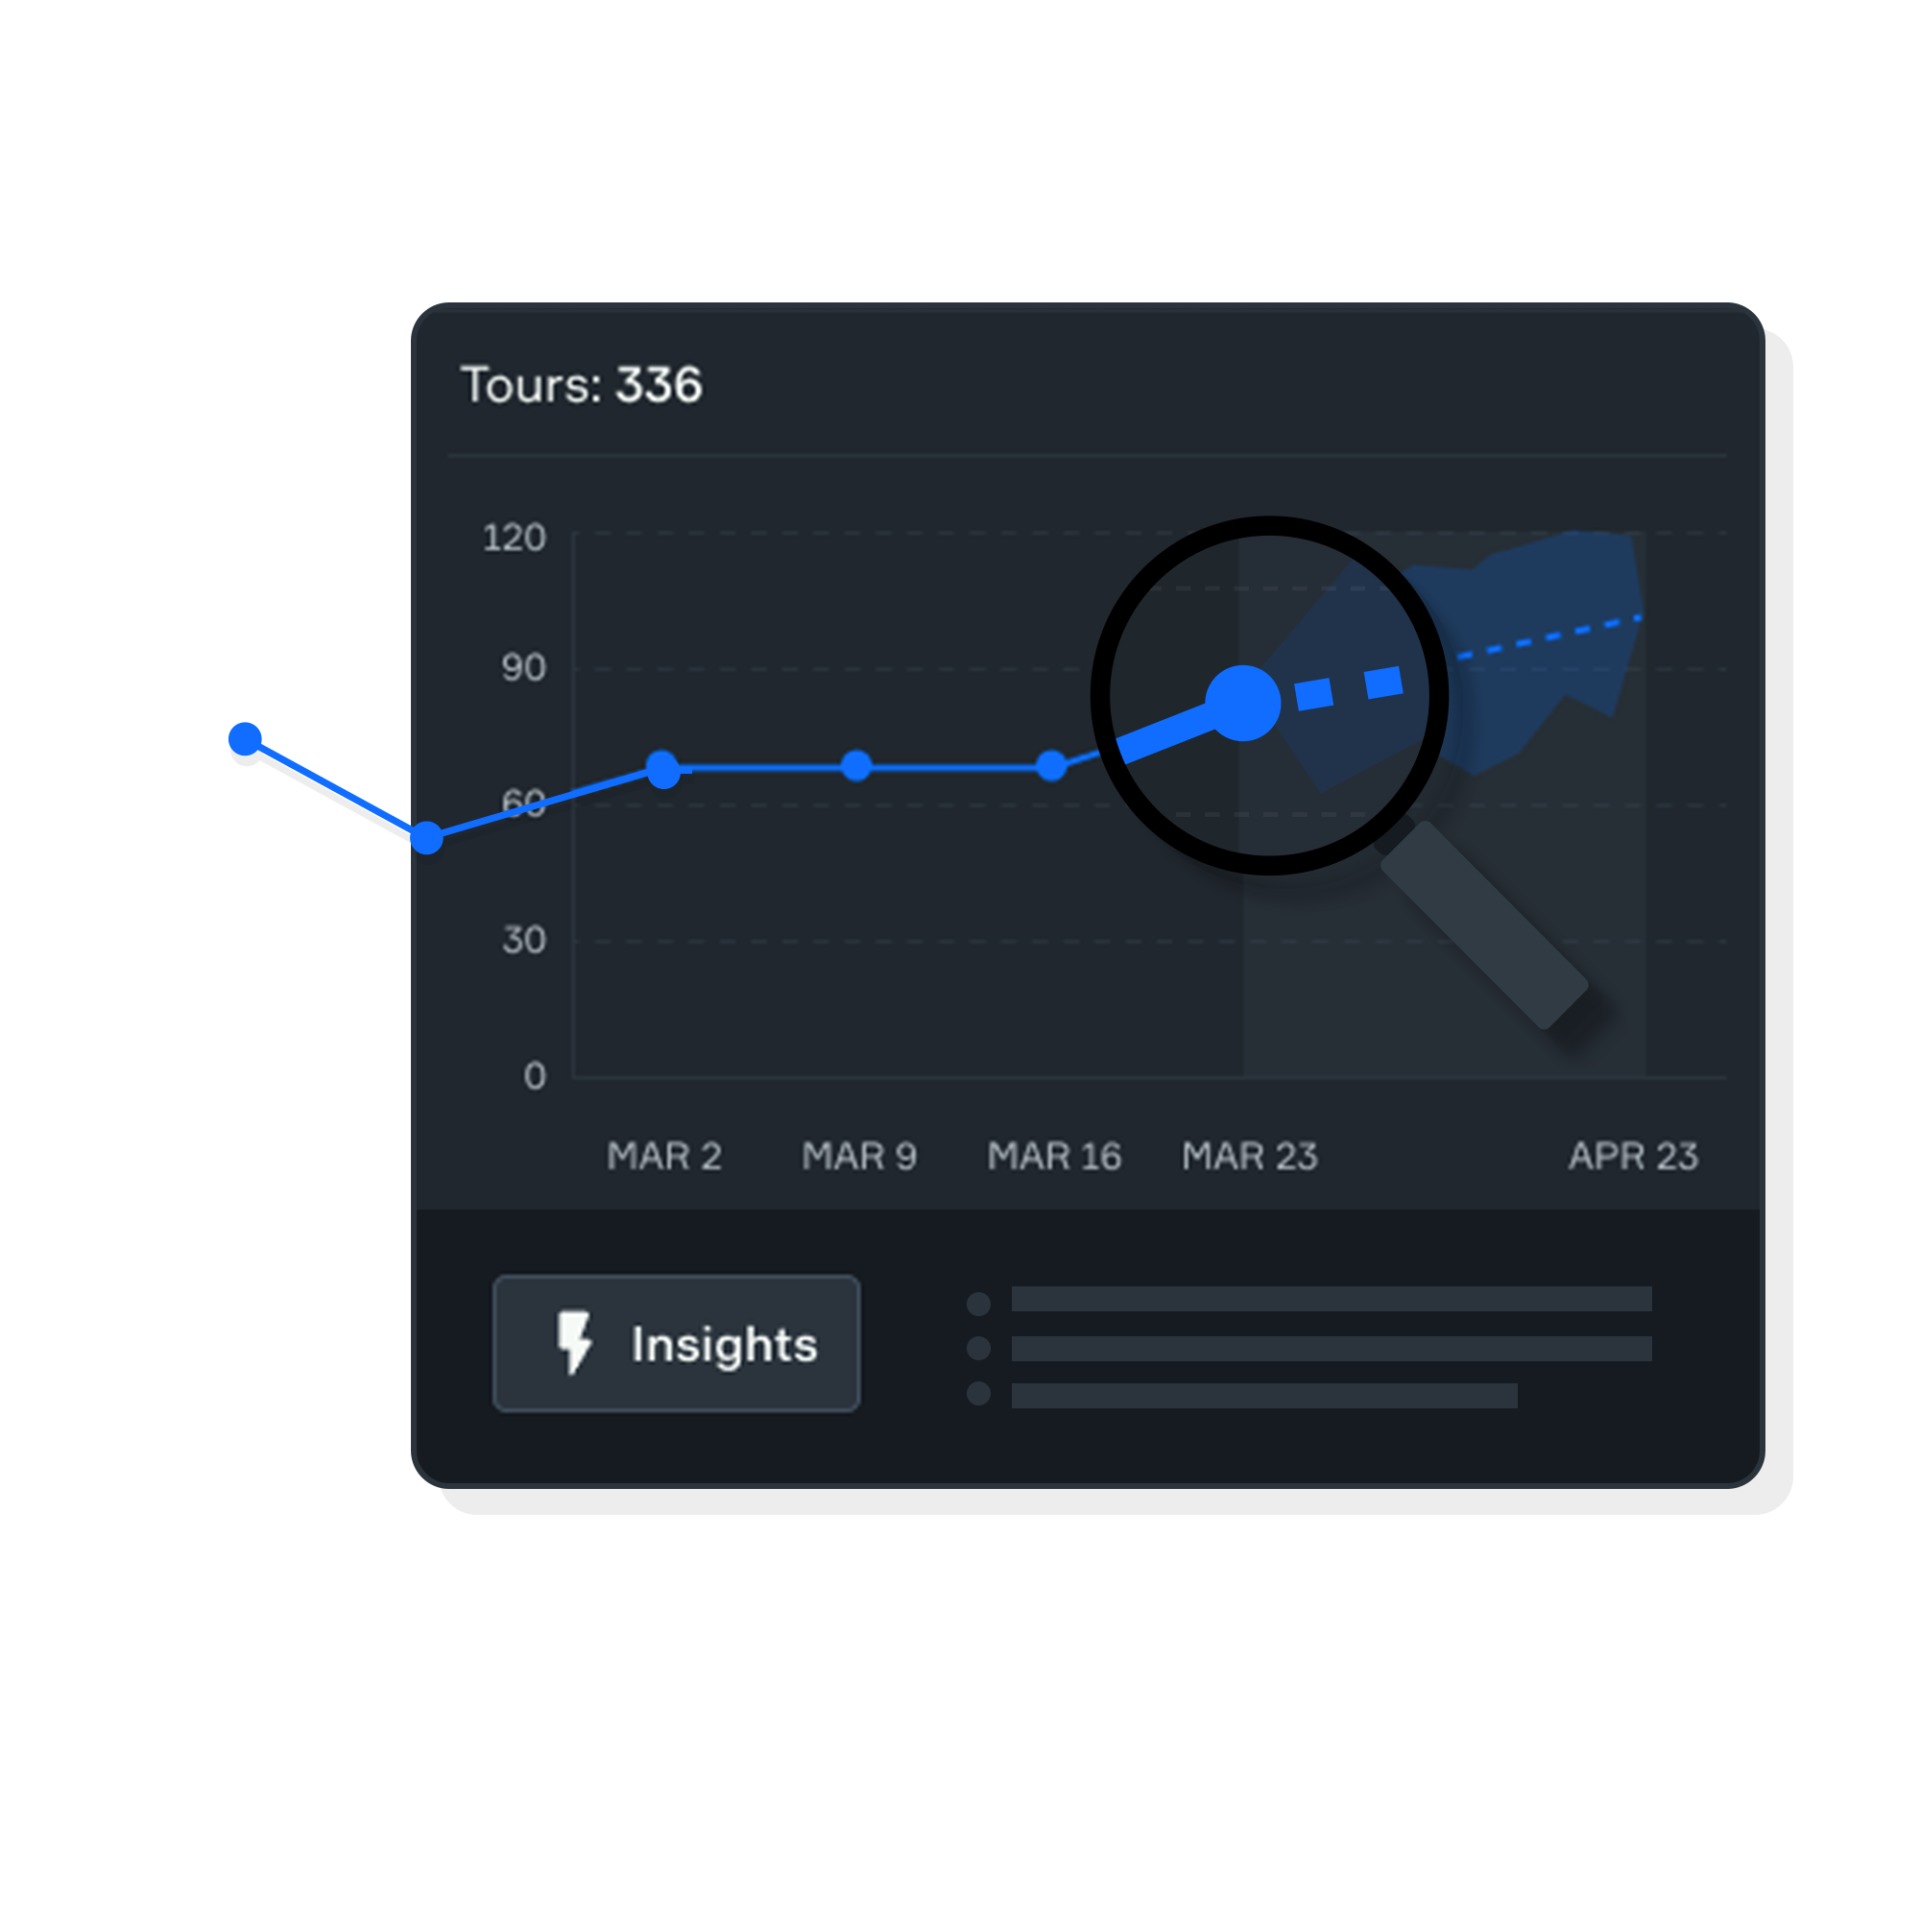
Proactively spot and understand trends, outliers, and patterns as they’re happening, not at the end of the month.

Monitor & manage marketing and leasing performance and easily identify the best and worst performers.

Visualize & Analyze Dashboard

Make better decisions.

Identify actual and potential property performance issues with predictive analytics and advanced alerts.

Drill down to row-level detail so you can gain a deeper understanding of each property.

Mitigate adverse trends and capitalize on positive ones with a consistent and complete view of your data.

Improved flexibility and greater capability to react to change both within the business and the market.

Report & Achieve

Keep everyone informed with
pinpoint reporting accuracy.

Get even more value from your data with forecasting and shareable reports that answer specific property and portfolio questions.

Report & Achieve Dashboard

Automate manual reporting processes.

Stop spending hours compiling data and building reports. Make beautiful, shareable reports in seconds.

Access easy-to-use marketing, leasing, retention, and financial reporting — all in the cloud.

Collaborate with your team and clients via online dashboards and reports any time of the day.

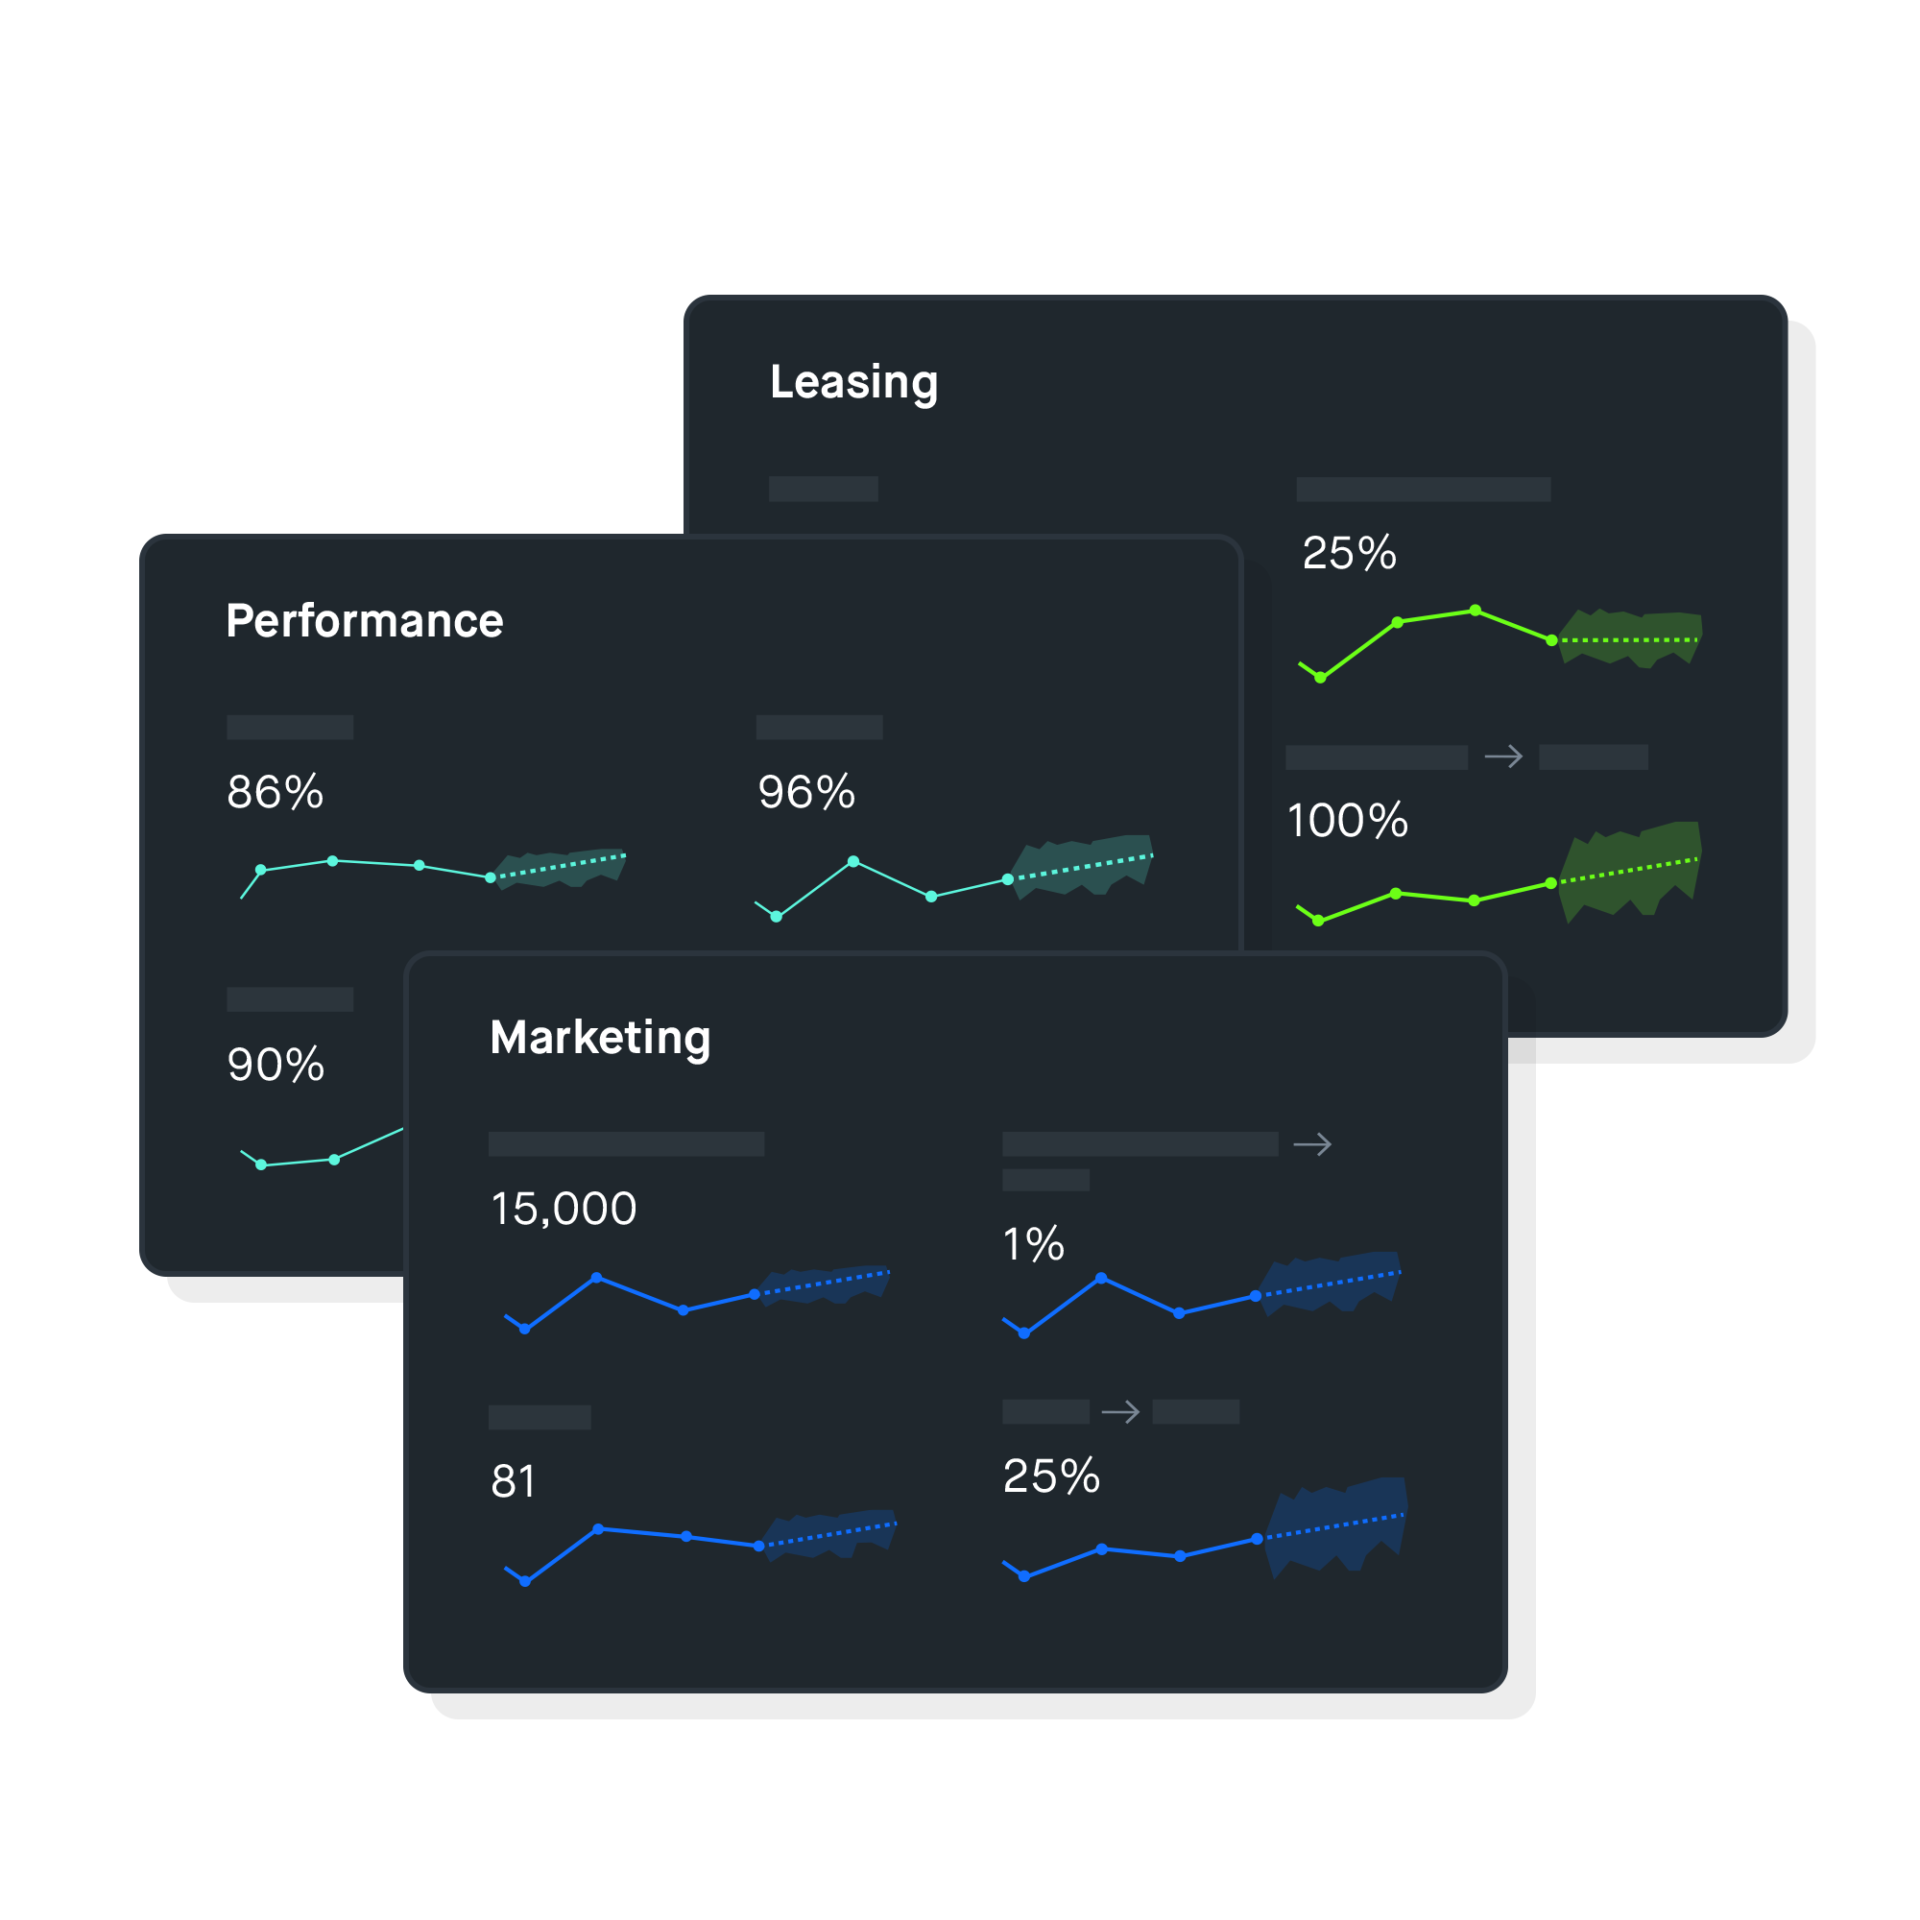
Easily create custom reports specific to each property’s funnel stage with your choice of over 20 of the top marketing and leasing KPIs.

Receive narrative insights.

Spot positive and negative trends with concise, text-based insights that reveal key drivers that impact performance.

Access untapped insights that pinpoint what’s impacting property performance, and help you confidently make data-driven decisions.

Receive weekly performance highs and lows by property group or individual assets.

Receive alerts right away when marketing, leasing, and retention KPIs deviate from threshold.
Receive weekly performance highs and lows by property group or individual assets.

See Remarkably in Action

Connect your data, receive actionable insights and alerts, and address property performance issues before they become problems.